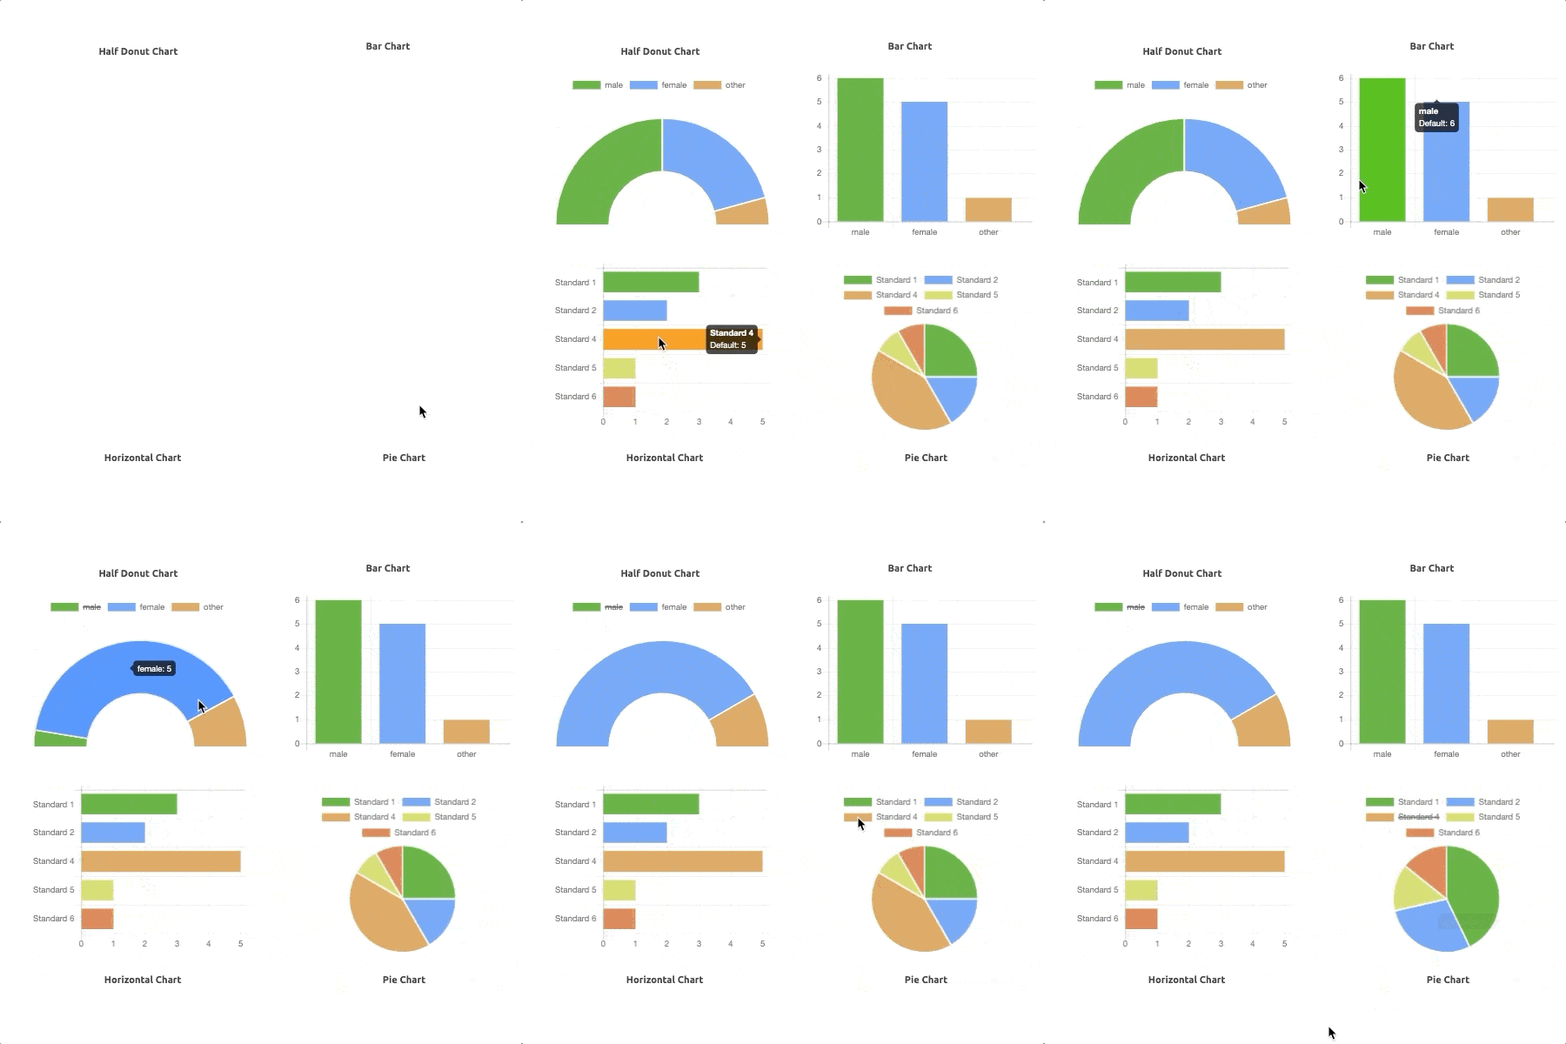
The Chart widget provides a visual representation of data in several formats, such as pie charts and bar charts.
- UI Type:
How to use chart widget?
Basic Usage:
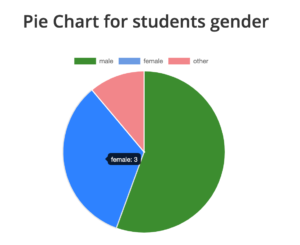
In this example, we will create a pie chart to output male and female students in a classroom.
Step 1: Initial setup
Create data models for students with appropriate attributes. Make sure we have “Gender” state attribute for students as it will be the identifier that we use for our chart. Ensure few student records are created to proceed with the chart.
Step 2: Query for the chart
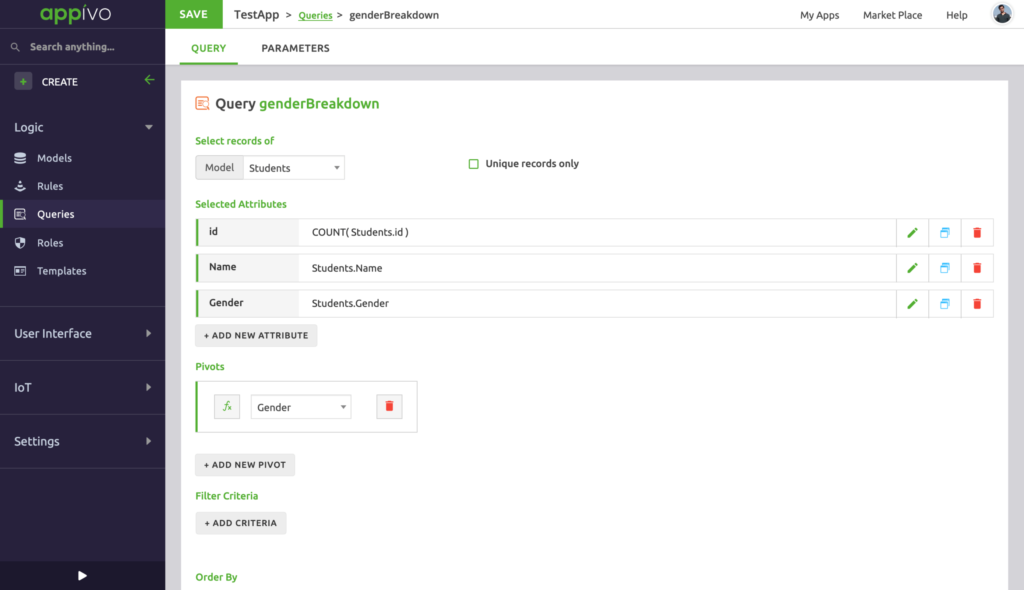
We need a query to output all students based on their gender to display in the pie chart. We create a query (for instance: genderBreakdown), where we choose records from student data model. For attributes we need count and gender of all students.
For count, you can edit/expand the ID attribute and use an inbuilt function called “Count”. You can add more attributes if required. For our example, ID (count) and gender will suffice.
In “Pivots”, we want to add Gender as the pivot point. This will bifurcate the students record output based on Gender. Your query should look like this by now:
Step 3: Configuring chart widget
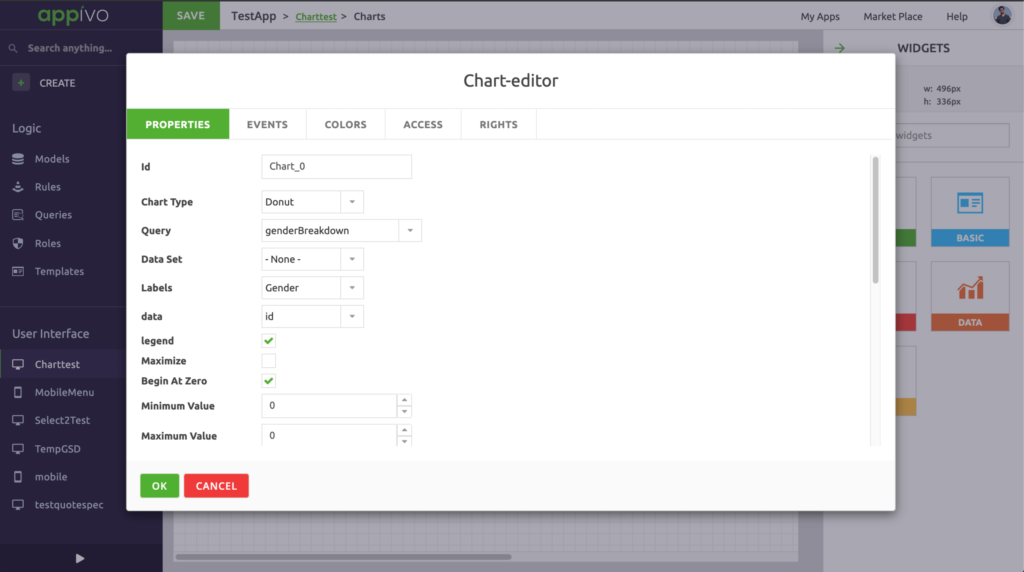
– Add chart widget to the view and select the chart type to start off. For this example you can use Pie chart or a Donut chart.
– Select query as the “genderBreakdown” query we just created.
– For value/data, use “ID” as the values from ID will be plotted on the chart.
– For labels, use “Gender” as the values will be plotted based on Gender.
You can set the start/end angle and cut out percentage (for donut chart) based on your preference. Go through the other options and set according to requirement. Your widget config should look like this by now.
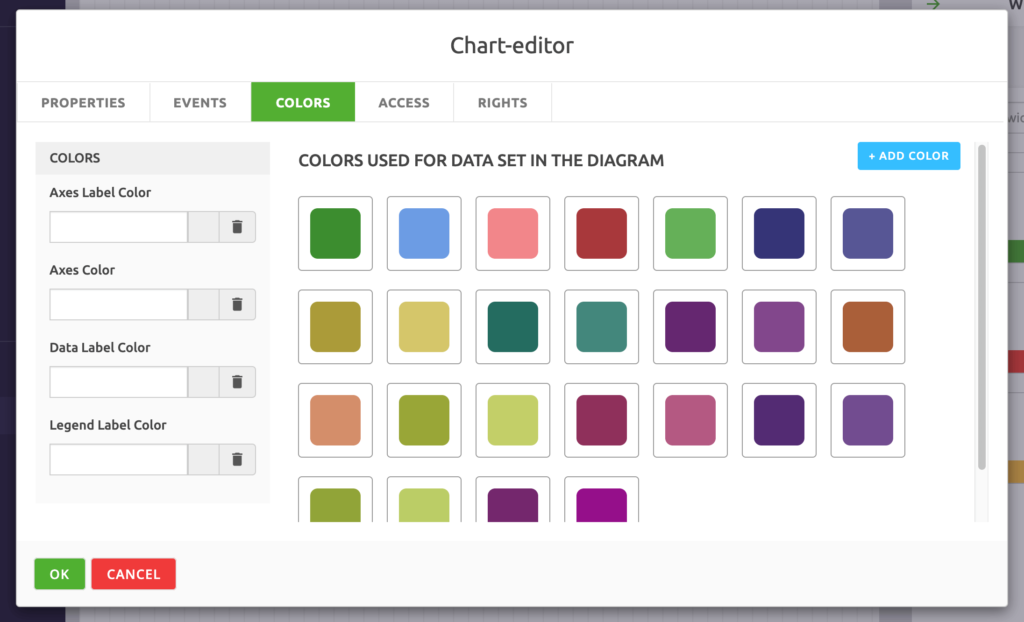
Additionally, you can customize the colors for the chart by navigating to colors tab in the widget editor. Based on the chart selected, you should get options to modify color values.
Step 4: Save and run the app
Your pie chart should display the student breakup of male, female or other genders.
- Properties 30
- Begin At Zero
- Chart Type
- Cutout Percentage
- Data Set
- Disabled
- Enable annotations
- End Angle
- Hidden
- Interpolate data
- Labels
- Legend
- Legend Formatter
- Maximize
- Maximum Value
- Minimum Value
- Point Radius
- Query
- Show X-axis ticks
- Show X-grid lines
- Show Y-axis ticks
- Show Y-grid lines
- Stacked Data
- Start Angle
- Steps
- Tab Index
- Value
- X-axis Formatter
- X-axis Label
- Y-axis Formatter
- Y-axis Label
- Style 4
- Events 4
- Functions 20
Properties
Style
Events
Function
getDataPointIndex ( event: Event )
Returns Datapoint index of point clicked from chart
Parameters
| Name | Type | Description |
|---|---|---|
| event | Event | User MouseEvent |
removeAnnotations ( id: String )
Removes an annotation from the chart
Parameters
| Name | Type | Description |
|---|---|---|
| id | String | The id or ids of the annotations to remove |
setAnnotations ( data: Object )
Adds or updates an annotation on the chart
Parameters
| Name | Type | Description |
|---|---|---|
| data | Object | Object with annotations keyed by their ids |
setColors ( colors: Array )
Sets the colors used when rendering the diagram
Parameters
| Name | Type | Description |
|---|---|---|
| colors | Array | Array of of colors. For Radar and Line charts, colors can be objects with properties backgroundColor, borderColor, pointBackgroundColor, pointBorderColor, pointHoverBackgroundColor, pointHoverBorderColor |
setData ( data: Array , options: Object )
Sets the data set that will be used to populate the chart
Parameters
| Name | Type | Description |
|---|---|---|
| data | Array | The data set to be used to populate the chart |
| options | Object | Options object for setting data, label and set attribute names |
setQuery ( queryName: String )
Sets the query used to populate the chart.
Parameters
| Name | Type | Description |
|---|---|---|
| queryName | String | The name of the query. |
showTooltip ( idx: Number )
Displays tooltip on datapoint of chart
Parameters
| Name | Type | Description |
|---|---|---|
| idx | Number | The idx used to select datapoint on chart |
get ( name: String ) →{ Object }
Gets the value of the specified property.
Parameters
| Name | Type | Description |
|---|---|---|
| name | String | The name of the property. |
Returns
The property's value.
isEnabled ( ) →{ Boolean }
Returns true if the widget is enabled.
Returns
True if enabled, otherwise false.
isHidden ( ) →{ Boolean }
Returns true if the widget is hidden.
Returns
True if hidden, otherwise false.
set ( name: String , value: Object )
Sets the value of the specified property.
Parameters
| Name | Type | Description |
|---|---|---|
| name | String | The name of the property. |
| value | Object | The new value. |
setEnabled ( Enabled: Boolean )
Enables/disables the widget.
Parameters
| Name | Type | Description |
|---|---|---|
| Enabled | Boolean | True to enable the widget, false to disable. |
